


What do the ratios of a Mutual Fund mean?

Hello there! I’m sure you guys have read about different ratios and metrics in a Mutual Fund - Alpha, Beta, Standard Deviation and what not. Yes, they all seem Greek and Latin to us. I know. It’s kinda complicated.
But that’s why you’ve subscribed to this newsletter, right?
This post is going to explain ratios and other metrics of a Mutual Fund in under 7 minutes (as promised always). Also I’m assuming that you’ve read part 1 and part 2 of this series. If not, do visit them first before you read this (won’t take more than 14 minutes - I swear).
Alright. So assuming you’ve read part 1 and part 2, let’s move on to the third part of the series to understand a Mutual Fund. Once you finish reading this, you’re going to understand everything about Mutual Funds. And in the next article, I’ll talk about how you can use all of this data to analyze any equity Mutual Fund.
Let’s take the screenshot of Moneycontrol to understand returns:

While most of it is self-explanatory, I’d like to focus on 2 things - Absolute returns and Annualized returns. Let’s take them one by one.
Now, this screenshot shows that if you invested Rs. 1,000 on different dates, what is the return you would get. The Absolute return is nothing but the percentage that the investment (of Rs. 1,000) has grown today. It does not take into account how many years it has been. So while this does give an idea of the growth of the investment, it does not give a very clear picture because it does not take the duration into account. If Rs. 1,000 invested 5 years ago grows to Rs. 1,200 today, the absolute return is 20%.
However, this return is over a period of 5 years. What if another investment of the same amount done 2 years ago, is giving 20% absolute return today (after 2 years)? How do you decide which one is better? The amounts are the same, but the duration is different! One is done for 5 years and the other is done for 2 years.
That’s where the Annualized return comes into play. While this is slightly more detailed in actuality, from a layman’s perspective if you were to understand, Annualized return is the growth of the investment every year. So while in 5 years you got 20%, the annualized return for the same would be 3.71%. Therefore, your investment grows by 3.71% every year and has totally grown by 20% in 5 years. In the same way, the second investment of Rs. 1,000 that has given you 20% in 2 years, actually has given annualized returns of 9.54%.
Basically, this means that the annual growth of the second investment is much better than the first one, since every year, the second investment grows by 9.54% but the first one only grows by 3.71%. Therefore, it is extremely important to see the Annualized returns of any investment and not the Absolute returns. If you want to understand the concept of Annualized returns (known as the CAGR) more accurately, there’s a brief post I wrote here. Have a look!
The next thing you see here is the Category Average. We have discussed that in part 2 of this series. In case you’ve forgotten about it, check it out here.
Now, let’s move to the next part of this post and understand a few more terms

Portfolio Turnover Ratio: This denotes how frequently the fund manager has changed the holdings (or stocks) of the Mutual Fund. So for example, if the Fund Manager has bought stocks worth Rs. 100 crore and sold stocks worth Rs. 50 crore, and the total AUM of the fund is Rs. 1,500 crore, then the Portfolio Turnover Ratio would be (100cr + 50cr)/1500cr = 10%. The turnover ratio should generally not be too high, as that may indicate that the fund manager is constantly changing the portfolio (however, this is not a rule - we’ll cover all of this in the next article)
Category average turnover, needless to mention, denotes the average turnover ratio of the category in which the fund is
The next section is self explanatory - it shows how much of the portfolio is invested in which securities (or products) - how much is invested in pure equity, how much in debt, how much in derivatives, the split between large cap, mid cap and small cap securities, etc.
The last section is important - it shows which companies the Mutual Fund has invested in. While the Mutual Fund has purchased stocks of many companies, the list here is typically of the top 10 holdings. You can have a look at these companies for one reason - to make sure that your investments across multiple Mutual Funds are actually diversified. For example, if you have invested in 2 different Mutual Funds, but both have invested in the same companies, you have not really diversified per se. Because eventually, the fate of your investment depends on the fate of the same companies. So this section should be seen to make sure that you are ACTUALLY diversifying your investment, and therefore your risk
Great! Now let’s come to the last part - Ratios!
I’ll explain each of the below ratios in brief, and in the next post, we’ll discuss how to use these ratios to analyze a Mutual Fund.
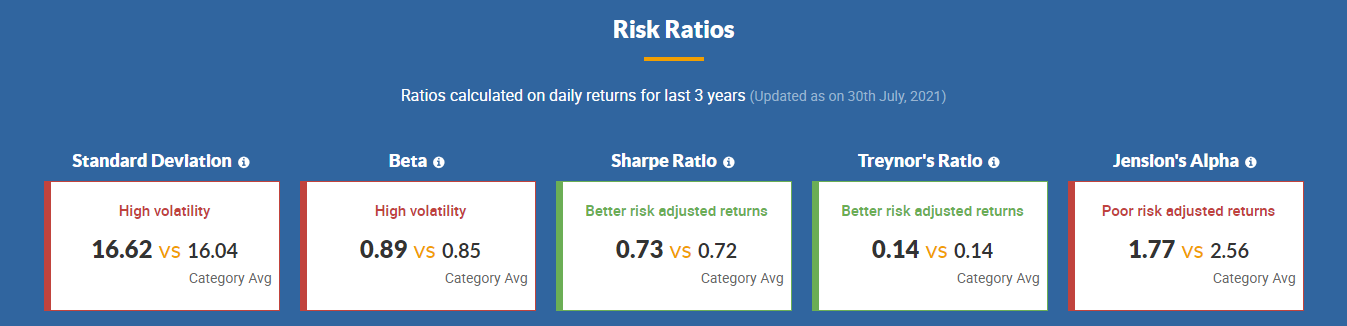
Standard Deviation: Simply put, this ratio indicates how volatile the Mutual Fund is, compared to the average returns during a given period (here it’s 3 years).
(What is volatility, you ask? It basically denotes the extent to which the NAV of the fund will fluctuate. Simply put, a fund whose NAV fluctuates more is said to be more volatile and vice versa. Understandably, higher the volatility, more is the risk of the Mutual Fund)
So coming back to SD, if the average return of the Mutual Fund in the last 3 years was 25% and the SD of the fund is 16, this means that generally, the return will vary between (25-16)% and (25+16)%. Higher the SD, higher the volatility (both, on the positive and negative side). Therefore, a fund with a high SD is typically a high-risk, high-return fund. The image shows that this fund is relatively more volatile than the category average, therefore, slightly riskier
Beta: This is also a measure of volatility, but while SD is a measure of volatility of a fund with respect to its average returns, beta is a measure of volatility of the fund with respect to the benchmark index (remember benchmark? We studied this in the previous post? Okay if you don’t, then read about it here). So, beta denotes how volatile the fund is compared to the benchmark index. A beta value < 1 indicates that the fund is less volatile compared to the index, while a beta value > 1 indicates that the fund is more volatile than the index. Again, higher volatility means higher risk (but possibility of higher returns as well). In the screenshot, you can see that the beta of this fund is higher than the beta of the category, which means it is relatively more volatile compared to the category average. But the value is less than 1, which means it is less volatile than its benchmark index. So while it may be less volatile than the benchmark, it is more volatile than the category. Don’t get confused, we’ll cover this analysis in the next post, next week!
Sharpe Ratio: Mathematically, the ratio may seem complicated, so I won’t get into the formula. But this ratio essentially indicates the return that the fund is giving for each unit of risk that is taken. So here, a sharpe ratio of 0.73 means that for every unit of risk that the fund takes, it earns 0.73 units of return. Now, common sense says that the sharpe ratio should be greater than 1, because if the fund is taking 1 unit of risk, the return should be at least 1 unit. But as we can see, in the given fund, that’s not the case. However, sharpe ratio alone cannot be used as a determinant for choosing a Mutual Fund. There are many more aspects, which we’ll cover in the next post.
[For all those who want to know the technicalities of sharpe ratio, you can read up about it here. The idea here is to simplify Personal Finance for you, not complicate it, so I won’t get into the mathematics]
Treynor Ratio: This is very similar to the sharpe ratio, in that it gives the return for each unit of risk taken. The only difference is that Treynor ratio is used for a diversified portfolio (which most Mutual Funds are). For simplicity, either of the two or both can be used by investors to analyze a Mutual Fund.
(Again, if you want to get into the details, Motilal Oswal has written a very good article about it here)
Alpha: This ratio indicates the additional return that the Mutual Fund is earning with respect to the benchmark. If the value of alpha is 0, that means it is earning returns that are equal to the benchmark. A value greater than 0 shows that the Mutual Fund has generated returns higher than the benchmark, and a value less than 0 indicates that the benchmark returns are better than this fund’s return. Again, let’s not get into the mathematics and complicate it, but there’s one point to remember - it is not just the pure difference between fund returns and benchmark returns (for example, if fund return = 12% and benchmark return = 10%, then alpha is NOT simply 12%-10%). Alpha takes the risk into account and then assigns a value. In essence, it indicates how much more returns the Mutual Fund is giving, with regards to the benchmark (after adjusting the risk taken by the fund). So to understand it from a normal investor’s perspective, it should be greater than 0. Otherwise you’re better off investing in an Index Fund. However, here you can see that though the alpha of Axis Long Term Equity Fund is high, the category alpha is even higher, which means we should further evaluate if there’s a better option (all of which we’ll do in the next post)
Well, that’s about it! If you have gone through this post and the other 2 posts in the series (link given in the beginning of this post), you have successfully understood all the important jargon behind a Mutual Fund. Just another week to go, and you’ll also be able to analyze Mutual Funds #LikeABoss.
Exciting? Drop me a comment on the post if you liked the series or are expecting something more. I’ll be happy to write more on this! :)
If you’ve not yet subscribed to the newsletter, please do so below to receive weekly newsletters on Personal Finance every Sunday!
PS: If you’re reading this in gmail, the newsletters may go to the “Promotions” or “Updates” tab in Gmail. Please drag the mail to “Primary” on your desktop (not mobile), and click on “YES” when Gmail asks “Do this for future messages from Substack?” so that you don’t miss these e-mails.
Absolutely love the simplicity with which seemingly technical concepts of finance are explained. The 7/8 minutes spent into reading an article are totally worth it as it makes me feel somewhat knowledgeable haha XD