


Do you want to predict a recession?
Yes, you can..

[Reading time: 5 minutes]
While there are multiple ways in which economists predict a recession, a very easy way that you can do it as a layman, is by examining something known as the Yield Curve.
I know this term itself sounds complicated, but stay with me for 5 minutes. This is really interesting!
Before we talk about the yield curve, let’s talk about bonds and yields.
First, let’s look at bonds (if you know how bonds work, you can skip this section and move to the next one; else read on!)
What are Bonds and Yields?
When companies or governments need money, they take loans from investors like you and me. When they take this loan, they issue a paper known as a BOND, which is nothing but a promise to pay the investor a regular interest and return the principal after a certain period. This period is known as the maturity period of the bond.
Now, the interest paid to the investors is known as the coupon (remember this word, since we’ll be using this throughout the article). This interest is a percentage of the face value of the bond, and not the price at which you bought the bond.
Sorry for bringing in more jargon. But if you’re wondering what’s the difference between face value and price of the bond, it’s this: The face value is the fair price that the corporate (or govt) wants to issue the bond for. This may be different from the actual price, because of things like demand and supply. So if a bond is in high demand, you may actually pay more than the face value, and if the demand is lower, you may pay lesser than the face value. However, the coupon (interest) is given on the face value only. So if you pay Rs. 150 for a bond that has a face value of Rs. 100, and if the coupon is 6%, you’ll only get Rs. 6 every year (6% of Rs. 100).
In this example, while the coupon is Rs. 6, the actual return on your investment is not 6%.
Because:
Your investment amount is more than Rs. 100
The coupon is coming every year, and not all at once. And the basic rule of finance says that money received earlier is better than money received later. So you need to consider the time value of money to calculate the actual return.
Okay, now the actual return that you get on your investment is calculated using a complex formula, that takes into consideration all of the above (we won't get into it, for simplicity).
But this actual return is known as the Yield of the bond.
Now a bond's yield is inversely related to its price. The higher your bond price is, the lower will be your bond yield, and vice versa.
Why, you ask? Because the coupon (interest) is a fixed percentage of your bond's FACE VALUE, but the actual price of the bond could be higher or lower than the face value, so your ROI (or yield) will be higher or lower depending on the actual price of the bond.
Okay, so what’s the Yield Curve?
So, a Yield Curve is a graph where the yields of bonds of various maturities are plotted, as shown in the sample image below. It basically shows what return these different bonds will give you over their lifespan.

Here's another concept - the longer you hold a bond, the higher is your risk. Because logically, your money is out for a longer time, so there is a longer time frame for any changes in the ecosystem, a borrower default or anything else to affect your investment.
So ideally, for longer maturity bonds, your return also should be higher. Because you’re taking more risk.
Therefore, in an ideal scenario, the yield curve should be upward sloping as shown in the above image, indicating that returns of longer-maturity bonds will be higher.
But sometimes, this yield curve becomes inverted. That means that the return on longer maturity bonds are lower than returns of shorter maturity bonds. Technically, this means that more people are opting for longer maturity bonds (even though they are more risky), thus driving up the price of the bond, and lowering the yield (inverse relation between price and yield, remember?)
An inverted yield curve looks something like this:
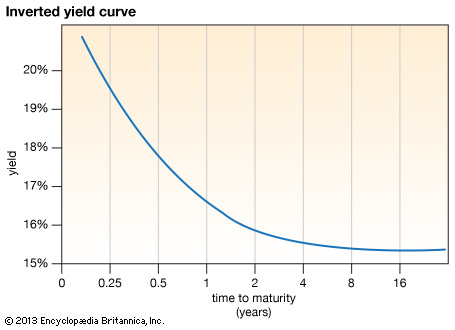
An inverted yield curve could mean three things:
Investors are probably investing in long-term bonds instead of stocks, which means they are not very optimistic about the equity market in the country (probably because it seems risky)
The government has increased interest rates for the shorter term, because they don’t want people to borrow money. This generally happens when there is a high inflation (and has currently happened in the US. If you want to know how increasing interest rates helps with inflation, read it HERE)
Since investors are buying more longer-maturity bonds, this is driving up the price and therefore reducing the yield of these bonds
Now, all of these indicate that the economy is not doing too well. And when the economy is not doing well, a recession could be around the corner.
Technically speaking, this is not a hard and fast rule. So it’s not always necessary that an inverted yield curve means a recession will follow. But in the past, an inverted yield curve in U.S. Treasuries has predicted every recession since 1955, with only one false signal during that time.
Unfortunately, currently, the US Yield Curve is inverted. Which means a recession could be around the corner. We can’t be 100% sure yet, but can only wait and watch!
In either case, at least now you can show off to your friends and tell them why the US may enter a recession! 😉
Well, today’s topic was really complex, so it may have gotten a bit long or boring to read. It’ll really help if you can let me know whether you understood it well, so that I can write more on such topics. You could like it, comment on it or just reply to this email; I’ll get the point 😁
And if you have any questions too, please feel free to shoot them in the comments, or reply to this email!
Here are two things I need help from you on
I’m planning to start a similar newsletter demystifying the Fintech space. So if you’d like to receive something like that, please let me know HERE
If you like reading our weekly newsletters, it would mean a lot of you could share it with friends on WhatsApp
See you next week!
Incredibly written for layman like me and it points to your in-depth knowledge in this domain. Looking forward to more
Intresting thing and a new learning! I'm wondering about the case when yield curve logic failed to predict the recession?